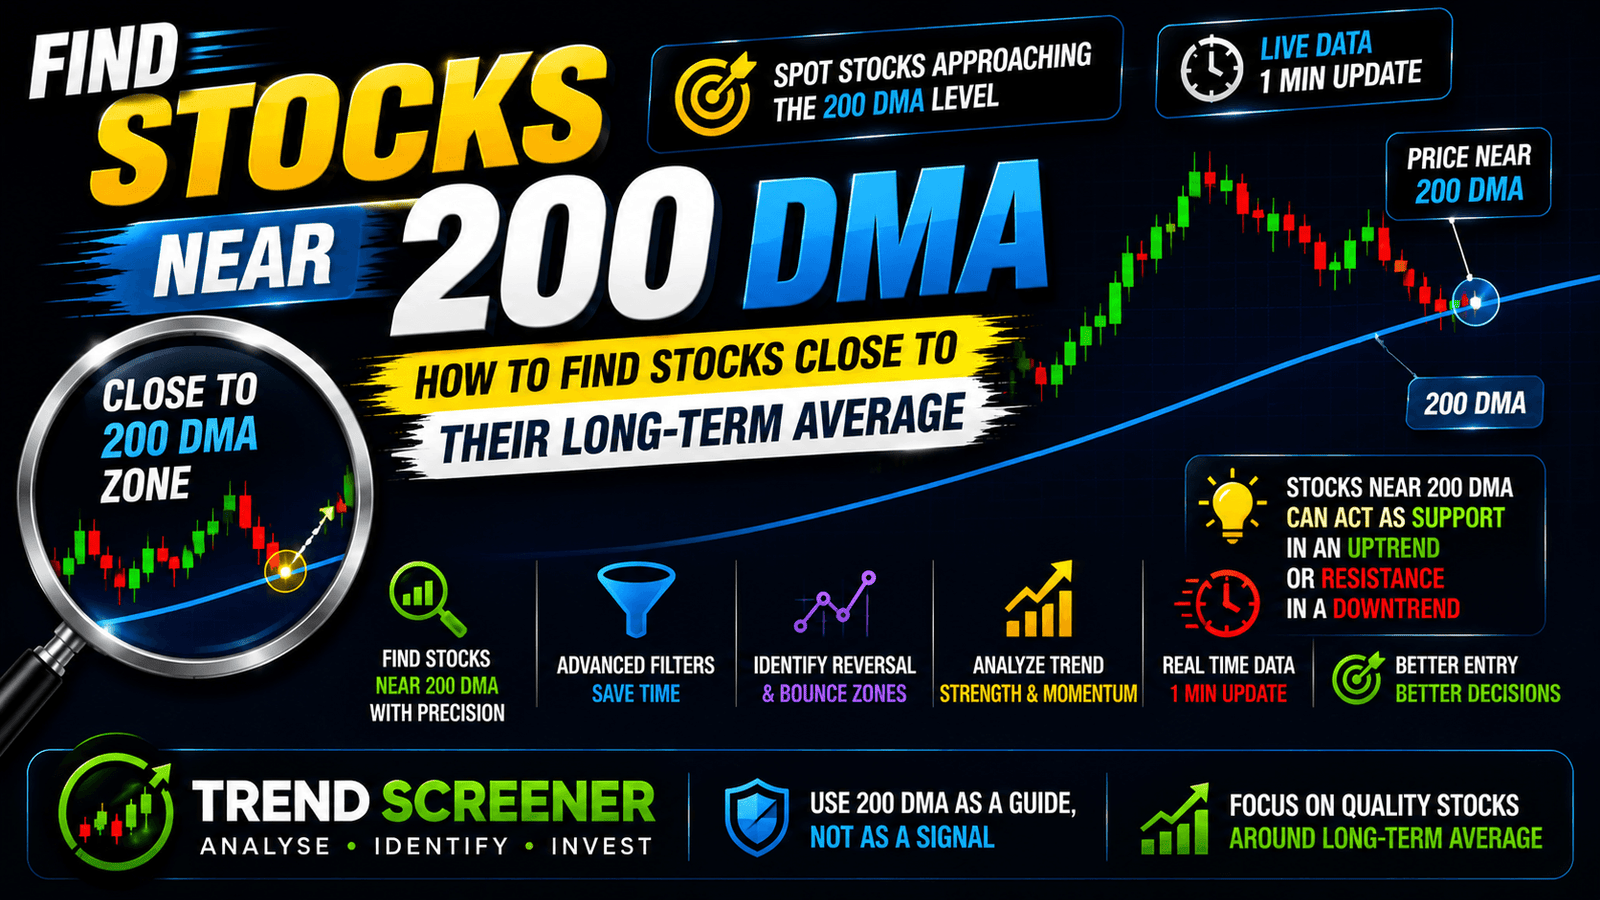
Stocks Near 200 DMA: How to Find Stocks Close to Their Long-Term Average
When a stock gets close to its 200 DMA, it often becomes worth watching.
The reason is simple: the 200 DMA is one of the most widely followed long-term moving averages, and the area around it can give traders useful information about the current trend.
But being near the 200 DMA does not automatically mean that the stock is at a good buying price.
A stock can bounce from the 200 DMA, break below it, move sideways around it, or simply pass through the level without any major reaction.
So instead of treating the 200 DMA as a guaranteed support or resistance level, it is better to look at what the price is actually doing around it.
What Does "Near 200 DMA" Mean?
A stock is considered to be near its 200 DMA when its current price is relatively close to its 200-day moving average.
For example, suppose a stock is trading at ₹1,000 and its 200 DMA is ₹990.
The price is only slightly above the moving average, so the stock can be considered close to its 200 DMA.
The exact distance used to define "near" can vary depending on the screening method.
Some traders may consider a stock within a few percentage points of the 200 DMA as being near the level, while a screener may use its own predefined range.
The important point is that the stock is close enough to the moving average for the level to become relevant to the analysis.
Why Do Traders Watch Stocks Near 200 DMA?
The 200 DMA is often used as a reference for the longer-term trend.
When the price gets close to this average, traders may want to see whether the stock holds the level or breaks through it.
For example:
Stock above 200 DMA → price moves down toward the average
This can make traders watch for a possible support reaction.
On the other hand:
Stock below 200 DMA → price moves up toward the average
This can make traders watch whether the average acts as resistance.
But neither situation guarantees what will happen next.
The reaction around the 200 DMA is more important than simply knowing that the stock is close to it.
Stocks Near 200 DMA Can Be Interesting From Both Sides
One useful thing about this type of screening is that it does not automatically assume the stock will go up.
A stock near its 200 DMA can be interesting to both bullish and bearish traders.
For example, consider two different situations.
Stock Approaching 200 DMA From Above
A stock has been trading above its 200 DMA but has recently fallen toward the average.
A trader may want to see whether the stock finds support and starts moving higher again.
Stock Approaching 200 DMA From Below
A stock has been trading below its 200 DMA and is now moving upward toward the average.
Here, the trader may watch whether the price can break above the moving average and hold there.
The same moving average can therefore become an important reference point in completely different setups.
Is the 200 DMA Support or Resistance?
It can be either.
This is an important point.
A moving average is not a fixed horizontal support or resistance line. It moves with the price because it is calculated from historical prices.
A stock that has been trading above a rising 200 DMA may find buyers around the average during a correction.
But if the stock breaks below the 200 DMA and the broader trend becomes weak, the same level may later act as resistance.
That is why it is better to observe how price behaves around the moving average rather than assuming in advance that it will hold.
What to Look for When a Stock Is Near 200 DMA
Finding stocks close to the 200 DMA is only the first step.
Once you have the list, there are several things worth checking.
1. Is the Stock Above or Below the 200 DMA?
This gives you the first bit of context.
A stock slightly above the average is in a different situation from one slightly below it.
2. Is the 200 DMA Rising or Falling?
The direction of the moving average matters.
A rising 200 DMA generally gives a different long-term trend picture from a declining 200 DMA.
3. How Did the Stock Reach the Level?
Look at the price movement before it reached the 200 DMA.
Did the stock gradually decline toward the average?
Did it fall sharply?
Did it recover from a previous low?
The path to the 200 DMA can provide useful context.
4. What Is Happening Around the Level?
Look at the candles around the moving average.
Is the price finding support?
Is it repeatedly failing to move above the average?
Is there a strong breakout or breakdown?
These details are more useful than simply knowing the distance from the 200 DMA.
5. What Is the Higher-Timeframe Trend?
A daily chart may show a stock near the 200 DMA, but the weekly and monthly charts can tell you whether the larger trend is supportive or weak.
This is particularly useful when a stock is making a move around an important long-term average.
Stock Above 200 DMA and Moving Toward It
This is one of the more common situations traders watch.
Suppose a stock has been in an uptrend and has remained above its 200 DMA for several months.
It then starts correcting.
Eventually, the price gets close to the 200 DMA.
At this point, the question is not simply:
"Will the stock bounce?"
A better question is:
"How is the stock behaving around the 200 DMA?"
If the price starts stabilising and the broader trend remains strong, the level may become important support.
But if the stock breaks below the average with strong selling pressure, the trend may be weakening.
This is why waiting for price behaviour can provide more information than trying to predict the reaction in advance.
Stock Below 200 DMA and Moving Toward It
The opposite situation is also worth watching.
Suppose a stock has been below its 200 DMA for several months.
Then it starts recovering and approaches the moving average from below.
Now the important question becomes whether the price can move above the 200 DMA and stay there.
A brief move above the average does not necessarily confirm a trend reversal.
You may want to see whether:
-
Price holds above the 200 DMA
-
The 200 DMA starts flattening or rising
-
Higher highs and higher lows develop
-
The weekly trend improves
-
Volume supports the move
The more of these conditions that line up, the more meaningful the move may become.
How to Find Stocks Near 200 DMA in India
If you are checking a large number of Indian stocks, finding these setups manually can take a lot of time.
A stock screener can make the first filtering step much easier.
The basic idea is to identify stocks where the current price is within a defined distance of the 200 DMA.
Once you have that shortlist, you can analyse the charts individually.
A simple process could be:
-
Find stocks near the 200 DMA.
-
Separate stocks approaching from above and below.
-
Check the direction of the 200 DMA.
-
Look at the weekly and monthly trend.
-
Study recent price action.
-
Check support and resistance.
-
Look at volume if it is relevant to your setup.
-
Use other indicators only when they add useful information.
This approach saves time because you are not searching through the entire market manually.
How to Find Stocks Near 200 DMA With TrendScreener
You can use the Near SMA Scanner on TrendScreener to find stocks trading close to important moving-average levels.
The scanner is available through the Near SMA Scanner.
You can also use the SMA Overview to compare different SMA conditions, including SMA 200.
Once you find a stock near its 200 DMA, the next step is to look at the actual price structure rather than assuming that the moving average will automatically act as support or resistance.
Near 200 DMA vs Above 200 DMA
These two screening conditions are useful for different purposes.
Stocks Above 200 DMA are generally used when you want to start with stocks that are already trading above their longer-term average.
Stocks Near 200 DMA are useful when you want to find stocks that are approaching or testing this important moving-average level.
You can read our detailed guide on Stocks Above 200 DMA if you want to understand the first setup in more detail.
The two screens can therefore complement each other rather than replacing one another.
Near 200 DMA and 50 DMA
The 50 DMA can provide additional context when analysing a stock near its 200 DMA.
For example, consider a stock where:
Price > 50 DMA > 200 DMA
This can indicate that the shorter/intermediate trend is stronger than the longer-term trend reference.
On the other hand, if:
Price < 50 DMA < 200 DMA
the overall price structure is weaker.
A stock near the 200 DMA can therefore become more interesting when you also understand where its 50 DMA is positioned.
Our guide on Stocks Above 50 DMA explains how traders can use the 50 DMA as an intermediate-term trend filter.
What Happens After a Stock Reaches Its 200 DMA?
There is no single answer.
A stock near its 200 DMA can:
-
Bounce higher
-
Break below the average
-
Break above the average
-
Move sideways
-
Test the level multiple times
This is why it is dangerous to assume that every stock near the 200 DMA will bounce.
The better approach is to watch the reaction and combine it with the larger trend.
Can You Buy a Stock Just Because It Is Near 200 DMA?
It is generally not a good idea to use proximity to the 200 DMA as the only reason for a trade.
Being close to the moving average tells you where the price is relative to a long-term average.
It does not tell you whether the stock will definitely bounce or break.
Before taking a decision, you can consider:
-
Overall market trend
-
Stock's sector trend
-
Price structure
-
Direction of the 200 DMA
-
Weekly and monthly trend
-
Volume
-
Recent support and resistance
-
Your own trading setup and risk management
The moving average should be part of the analysis rather than the entire analysis.
A Simple Way to Analyse Stocks Near 200 DMA
If you want to keep the process simple, you can follow these steps.
Step 1: Create a Shortlist
Start with stocks trading close to their 200 DMA.
Step 2: Identify the Direction
Check whether the stock is approaching the 200 DMA from above or below.
Step 3: Check the Moving Average
See whether the 200 DMA itself is rising, flat or falling.
Step 4: Study Price Action
Look at how the stock is behaving around the level.
Step 5: Check Higher Timeframes
Use weekly and monthly charts to understand the larger trend.
Step 6: Wait for Confirmation
If your strategy requires confirmation, wait for price action to provide it instead of assuming the 200 DMA will hold.
Step 7: Manage Risk
No moving average works every time. If you take a trade based on a setup around the 200 DMA, your risk management should be decided before entering.
Frequently Asked Questions
What does it mean when a stock is near 200 DMA?
It means the current price is relatively close to its 200-day moving average. Traders often watch these stocks because the 200 DMA can be an important reference for the longer-term trend.
Is a stock near 200 DMA bullish?
Not necessarily. A stock can approach the 200 DMA from above during a correction or from below during a recovery. The direction and price behaviour around the average are important.
Can 200 DMA act as support?
It can act as support in some situations, particularly when a stock is in a broader uptrend and buyers step in around the moving average. However, it is not guaranteed to hold.
Can 200 DMA act as resistance?
Yes. A stock trading below its 200 DMA can sometimes face selling pressure when it approaches the average from below. Again, the actual price reaction matters.
Should I buy a stock near 200 DMA?
Being near the 200 DMA alone is not enough to make a buy decision. It is better to consider the broader trend, price action, market conditions and your own trading setup.
What is the difference between stocks near 200 DMA and stocks above 200 DMA?
Stocks above 200 DMA are already trading above their longer-term average. Stocks near 200 DMA are close to that average and may be approaching, testing or moving away from the level.
Final Thoughts
Stocks near 200 DMA can be useful to watch because the area around the 200-day moving average can provide an important piece of information about the longer-term trend.
But the key is not simply finding a stock that is close to the average.
What matters is how the stock behaves when it gets there.
A stock approaching the 200 DMA from above may be testing potential support. A stock approaching it from below may be testing potential resistance.
In both cases, the 200 DMA is best used as a reference point rather than a guaranteed signal.
A screener can make the discovery process much faster. Once you have the shortlist, the real work is understanding the trend, price structure and reaction around the level.