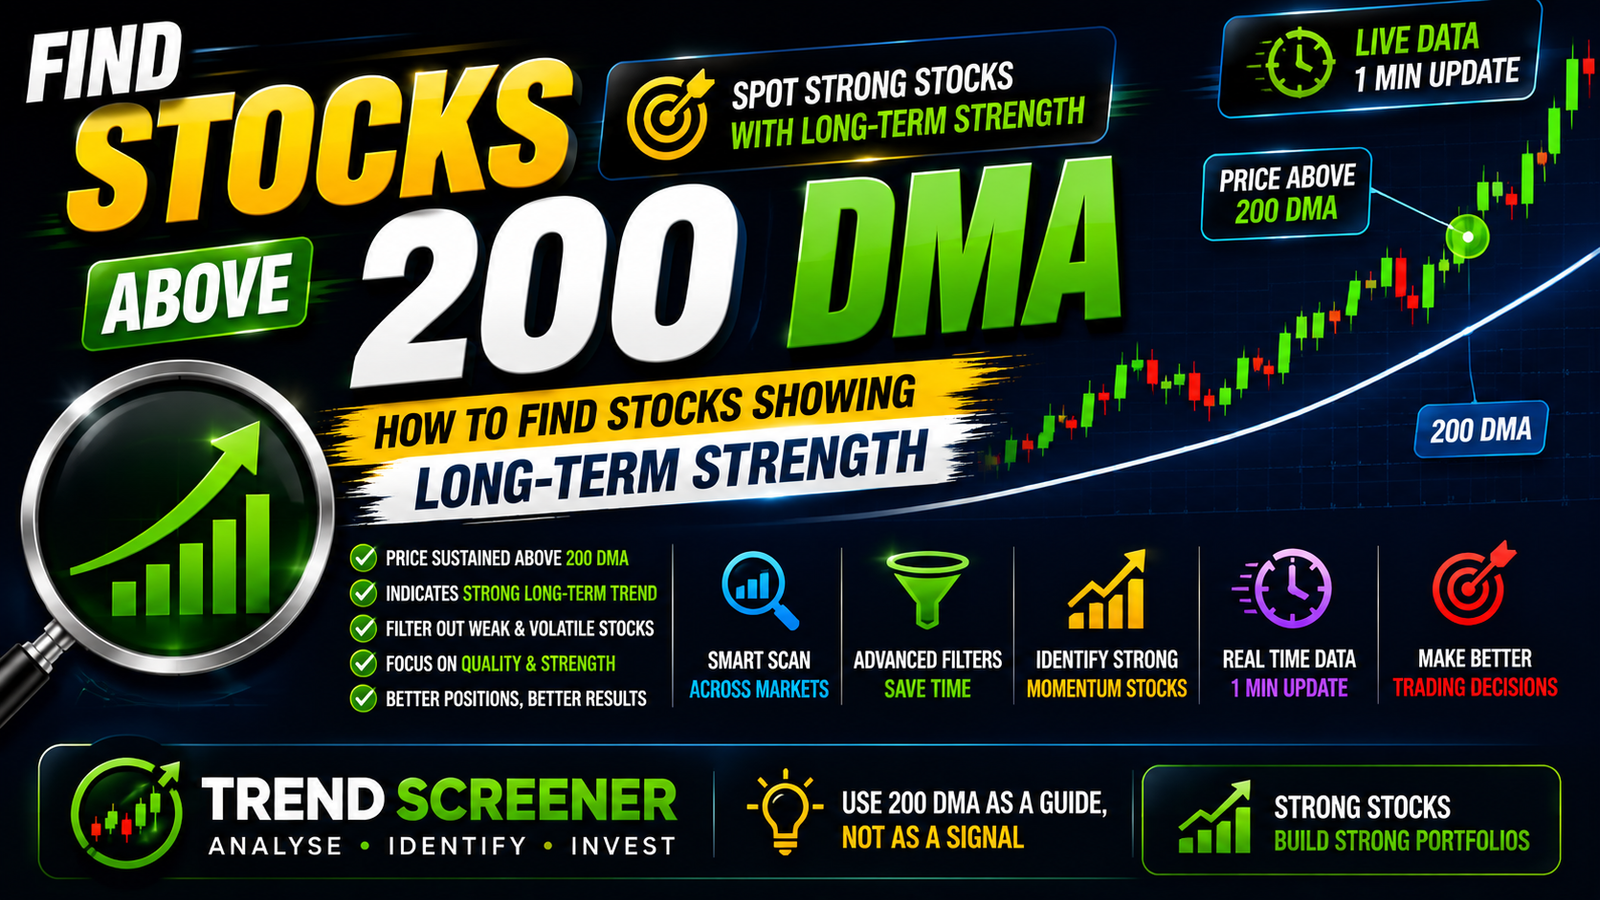
Stocks Above 200 DMA: What It Means and How to Find Them
When you are looking for stocks for a positional or longer-term trade, one of the first things worth checking is the overall trend.
The 200 DMA is one of the simplest ways to get that first picture.
A stock trading above its 200 DMA is generally considered to be showing better long-term strength than a stock trading below it. But that does not mean the stock will automatically continue rising. Price can still fall, move sideways, or give a false breakout.
That is why it is better to use the 200 DMA as a trend filter rather than treating it as a standalone buy or sell signal.
What Is 200 DMA?
200 DMA stands for 200-Day Moving Average.
It represents the average closing price of a stock over its most recent 200 trading days. As a new trading day is added, the oldest day drops out of the calculation, so the average keeps changing with the market.
For example, suppose a stock is trading at ₹1,500 and its 200 DMA is ₹1,350.
In that case, the stock is trading above its 200 DMA.
This simply tells us that the current price is higher than its average closing price over roughly the last 200 trading sessions.
You may also see the term 200 SMA or 200-day SMA used for this type of calculation because it is a simple moving average based on the last 200 closing prices.
What Does It Mean When a Stock Is Above 200 DMA?
When a stock is trading above its 200 DMA, its current price is above its longer-term average.
Many traders use this as a quick way to identify stocks that are showing relative long-term strength.
A simple interpretation is:
-
Price above 200 DMA → stronger long-term price position
-
Price below 200 DMA → weaker long-term price position
-
Price moving around 200 DMA → trend may be unclear
-
Price above 200 DMA while the average is rising → stronger trend confirmation
These are not fixed trading rules. A stock can move above its 200 DMA and fall back below it a few days later.
That is why the direction of the moving average and the actual price structure are also worth checking.
Why Do Traders Watch the 200 DMA?
The 200 DMA is popular because it gives traders a simple view of the longer-term direction of a stock.
If you are checking hundreds of stocks, opening every chart and trying to judge the long-term trend manually can quickly become tiring. The 200 DMA gives you a simple reference point to start with.
For example, if you are looking for stocks showing long-term strength, you could start by looking at stocks trading above their 200 DMA.
You can then narrow the list further by checking:
-
Whether the 200 DMA is rising
-
Recent price action
-
Breakouts
-
Volume
-
RSI
-
50 DMA or 100 DMA
-
Weekly trend
-
Monthly trend
This is where a moving average becomes more useful as a filter rather than a complete trading strategy.
Stocks Above 200 DMA vs Stocks Below 200 DMA
The basic difference is easy to understand.
| Price position | What it may indicate |
|---|---|
| Above 200 DMA | Long-term price strength |
| Below 200 DMA | Long-term price weakness |
| Just above 200 DMA | Possible trend transition |
| Just below 200 DMA | Possible weakness |
| Well above 200 DMA | Strong momentum, but the stock may also be extended |
A stock being above its 200 DMA does not automatically make it a good investment or trade. It is simply one piece of information that can help you understand the current trend.
Does a Stock Above 200 DMA Mean It Is Bullish?
Not always.
This is an important point because it is easy to assume that every stock above its 200 DMA is automatically bullish.
Imagine a stock that has been falling for several months and then moves above its 200 DMA.
That move may be an early sign that the trend is improving, but it does not confirm that a sustained uptrend has started.
On the other hand, a stock that is above its 200 DMA, has a rising 200 DMA, and is consistently making higher highs and higher lows gives a much stronger trend picture.
So rather than asking only:
"Is the stock above 200 DMA?"
it can be more useful to ask:
"Is the stock above 200 DMA and is the overall trend improving?"
How to Find Stocks Above 200 DMA in India
If you are checking a few hundred stocks, doing this manually can take a lot of time.
This is where a stock screener can make the first filtering step much easier.
Instead of opening individual charts one by one, you can first create a shortlist of stocks that meet a condition such as:
Current Price > 200 DMA
After that, you can analyse only the stocks that match the condition.
A practical checklist could be:
-
Is the stock above its 200 DMA?
-
Is the 200 DMA rising?
-
Is the weekly trend supportive?
-
Is the monthly trend supportive?
-
Is the stock close to a recent high?
-
Is there a breakout?
-
Is RSI showing strength or an already extended move?
-
Is the price holding an important support level?
The purpose of screening is not to find a guaranteed winner. It is simply to reduce a large universe of stocks to a smaller list that deserves closer attention.
How to Find Stocks Above 200 DMA With TrendScreener
If you want to scan Indian stocks based on moving averages, you can start with TrendScreener.
The SMA Overview provides moving-average based scanners for SMA 20, SMA 50, SMA 100 and SMA 200.
This makes it easier to shortlist stocks based on their position relative to important moving averages instead of checking every stock manually.
If you are looking for stocks trading close to an important moving-average level, the Near SMA Scanner can also be useful.
Once you have a shortlist, you can move on to the broader trend and price action before making any trading decision.
50 DMA vs 200 DMA
Both moving averages are useful, but they respond differently to price changes.
The 50 DMA reacts faster to recent price movements, while the 200 DMA moves more slowly and is commonly used to understand the longer-term trend.
A simple way to think about them is:
50 DMA → shorter/intermediate trend
200 DMA → longer-term trend
When a stock is above both moving averages and both are rising, the overall trend can look stronger.
The relationship between the 50 DMA and 200 DMA is also watched by many traders because major crossovers can sometimes indicate a change in trend.
What Happens When a Stock Crosses Above 200 DMA?
A move from below the 200 DMA to above it can attract attention because it may indicate that the longer-term trend is changing.
But not every crossover is meaningful.
There is a big difference between:
Price briefly moving above the 200 DMA
and:
Price breaking above the 200 DMA, holding above it and continuing to build a stronger price structure.
The second situation gives more confirmation.
If you are specifically interested in bullish moving-average crossovers, you can also explore TrendScreener's SMA Crossover Scanner.
Can a Stock Above 200 DMA Still Fall?
Yes.
The 200 DMA is not a permanent support level.
A stock can stay above its 200 DMA for months and later fall below it because of weak earnings, sector weakness, broader market selling or other developments.
This is why the 200 DMA should not be treated as a guarantee.
It is better to think of it as one tool that helps you understand where the stock currently stands in its longer-term trend.
A Simple Way to Use 200 DMA in Stock Analysis
You do not need a complicated strategy to make the 200 DMA useful.
Step 1: Find Stocks Above 200 DMA
Start by identifying stocks whose current price is above the 200-day moving average.
Step 2: Check the Direction of the Moving Average
A rising 200 DMA generally gives a better trend picture than a flat or declining average when you are looking for long-term strength.
Step 3: Check Higher Timeframes
Look at the weekly and monthly trend. This can help you avoid relying entirely on a short-term move.
Step 4: Look at Price Structure
Check whether the stock is making higher highs and higher lows, breaking out, or simply moving sideways.
Step 5: Use Other Indicators Only When They Add Value
RSI, volume, support and resistance can provide additional information.
The goal is not to put as many indicators as possible on a chart.
The goal is to get enough information to make a more informed decision.
Frequently Asked Questions
What does it mean when a stock is above 200 DMA?
It means the current price is trading above its average closing price over the last 200 trading days. Traders often use this as an indication of longer-term price strength.
Is a stock above 200 DMA always bullish?
No. Being above the 200 DMA does not guarantee that the stock will continue rising. The direction of the moving average, price structure and higher-timeframe trend should also be considered.
Can a stock above 200 DMA fall?
Yes. A stock can remain above its 200 DMA and later fall below it because of company-specific news, sector weakness or broader market conditions.
What is the difference between 50 DMA and 200 DMA?
The 50 DMA responds more quickly to recent price changes and is often used to understand the shorter or intermediate trend. The 200 DMA moves more slowly and is commonly used to assess the longer-term trend.
Is 200 DMA useful for short-term trading?
It can be useful as a broader trend filter, but it is a relatively slow-moving indicator. Short-term traders may combine it with shorter timeframes and other forms of price analysis.
Final Thoughts
Stocks trading above their 200 DMA can be a useful starting point when you are looking for stocks showing longer-term strength.
But the 200 DMA should not be treated as a magic buy or sell signal.
A better approach is to use it as a trend filter and then look at the direction of the moving average, price structure and higher-timeframe trend.
For anyone scanning a large number of Indian stocks, a stock screener can make this process much faster. Instead of manually opening hundreds of charts, you can first create a shortlist and then spend your time analysing the stocks that actually match your criteria.
The 200 DMA is not about predicting exactly what a stock will do next. It is simply a way of putting the current price into a longer-term context.