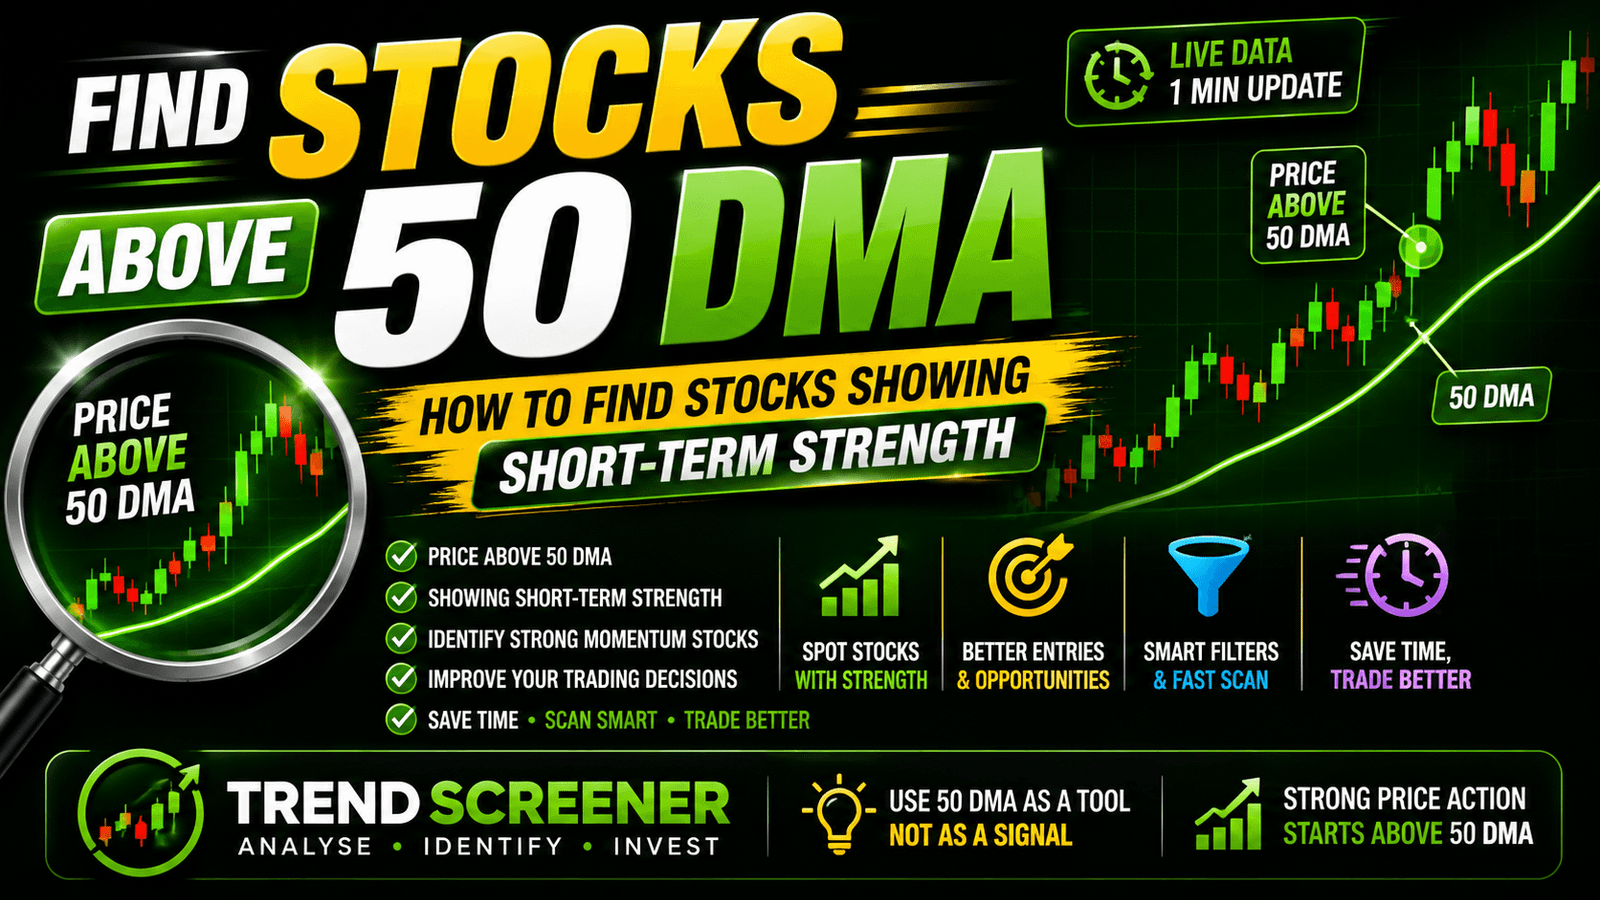
Stocks Above 50 DMA: How to Find Stocks Showing Short-Term Strength
When you are scanning stocks for a possible trade, one of the first things you usually want to know is whether the stock is showing strength or weakness.
The 50 DMA can be a useful starting point.
A stock trading above its 50 DMA is generally showing that its current price is above its average price over the last 50 trading sessions. Traders often use this as a way to identify stocks with improving or relatively stronger intermediate-term price action.
But, just like the 200 DMA, the 50 DMA is not a buy signal by itself.
A stock can move above the 50 DMA and fall back below it. It can also stay above the average while moving sideways.
So the real value comes from looking at the 50 DMA together with the direction of the average, price structure and the broader trend.
What Is 50 DMA?
50 DMA stands for 50-Day Moving Average.
It is the average closing price of a stock over its most recent 50 trading days. Because a new trading day is added and the oldest one drops out, the average keeps moving with the price.
For example, suppose a stock is trading at ₹1,200 and its 50 DMA is ₹1,100.
The stock is currently trading above its 50 DMA.
This tells us that the current price is above its average closing price over roughly the last 50 trading sessions.
You may also see it written as 50 SMA or 50-day SMA when the calculation uses a simple moving average.
If you want to understand how different moving averages are used for stock screening, you can explore the SMA Overview on TrendScreener.
What Does It Mean When a Stock Is Above 50 DMA?
When a stock is above its 50 DMA, its current price is higher than its recent 50-day average.
This can be a useful sign when you are looking for stocks that are showing intermediate-term strength.
A simple interpretation is:
-
Price above 50 DMA → stronger recent price position
-
Price below 50 DMA → weaker recent price position
-
Price repeatedly moving around 50 DMA → trend may be unclear
-
Price above a rising 50 DMA → stronger trend confirmation
However, none of these should be treated as a guaranteed trading signal.
The direction of the 50 DMA matters.
A stock that is just above a falling 50 DMA is very different from a stock that has been above a steadily rising 50 DMA for several weeks.
Why Do Traders Watch the 50 DMA?
The 50 DMA reacts faster to price changes than longer-term moving averages such as the 200 DMA.
That makes it useful when traders want to understand whether a stock's recent trend is improving or weakening.
For example, imagine a stock that has been below its 50 DMA for several weeks.
If it starts moving above the average and the 50 DMA also begins turning upward, the stock may deserve a closer look.
But instead of immediately taking a position, you can use that move as a reason to investigate further.
You could then check:
-
Price structure
-
50 DMA direction
-
200 DMA
-
Weekly trend
-
Monthly trend
-
Recent highs and lows
-
Volume
-
RSI
-
Support and resistance
This gives you more context than simply looking at whether the price is above one moving average.
If you want to understand the longer-term side of the same analysis, see our guide on Stocks Above 200 DMA.
Stocks Above 50 DMA vs Stocks Below 50 DMA
The basic idea is straightforward.
| Price position | What it may indicate |
|---|---|
| Above 50 DMA | Stronger recent/intermediate price position |
| Below 50 DMA | Weaker recent/intermediate price position |
| Just above 50 DMA | Possible trend improvement |
| Just below 50 DMA | Possible weakness |
| Well above 50 DMA | Strong momentum, but the stock may also be extended |
These are observations, not fixed trading rules.
A stock can be above its 50 DMA and still fall sharply the next day. Similarly, a stock can trade below its 50 DMA and later recover.
The moving average helps put the current price into context. It does not predict the next candle.
Does a Stock Above 50 DMA Mean It Is Bullish?
Not necessarily.
This is one of the most important things to understand.
Suppose a stock has been falling for a long time and suddenly moves above its 50 DMA.
That is worth noticing, but it does not automatically mean that a new uptrend has started.
The move becomes more interesting when other parts of the chart support it.
For example:
Price above 50 DMA + rising 50 DMA + higher highs and higher lows
gives a different picture from:
Price barely above a flat or falling 50 DMA.
This is why it is better to look at the overall setup rather than one condition.
How to Find Stocks Above 50 DMA in India
If you want to check hundreds of Indian stocks, manually opening every chart is not a practical way to start.
A stock screener can first filter the stocks for you.
The basic condition is:
Current Price > 50 DMA
Once you have that shortlist, you can spend more time studying the stocks that actually match your criteria.
A simple screening process could be:
-
Find stocks trading above their 50 DMA.
-
Check whether the 50 DMA is rising.
-
Check whether the stock is also above its 200 DMA.
-
Look at the weekly trend.
-
Check recent price action.
-
Look for a breakout or higher-high structure.
-
Check volume and RSI if they are relevant to your setup.
-
Avoid treating the screen itself as an entry signal.
This approach can make the first stage of stock selection much quicker.
What If a Stock Is Above Both 50 DMA and 200 DMA?
This is where the 50 DMA becomes even more useful.
Suppose a stock is:
Above 50 DMA
and also:
Above 200 DMA
Now you have information about both its recent and longer-term price position.
The 50 DMA reacts faster, while the 200 DMA moves more slowly.
So when the price is above both averages and both averages are rising, the overall trend can look more constructive.
But again, this does not mean the stock is guaranteed to rise.
It is better to think of the two moving averages as filters that help you understand the trend.
For example:
Price > 50 DMA > 200 DMA
can indicate a stronger alignment than a situation where the price is above the 50 DMA but still below the 200 DMA.
The exact setup should still be checked against the chart and market conditions.
If you want to understand the longer-term filter in more detail, you can also read Stocks Above 200 DMA.
50 DMA vs 200 DMA
The main difference is how quickly they respond to price changes.
50 DMA
The 50 DMA reacts relatively quickly to recent price movements. It can therefore be useful for understanding an intermediate trend and changes in momentum.
200 DMA
The 200 DMA reacts much more slowly and is commonly used as a longer-term trend reference.
A simple way to remember it is:
50 DMA → recent/intermediate trend
200 DMA → longer-term trend
This is also why a stock can move above its 50 DMA while still remaining below its 200 DMA.
In that situation, the recent trend may be improving, but the longer-term trend has not necessarily changed yet.
What Happens When a Stock Crosses Above 50 DMA?
A move from below the 50 DMA to above it can attract attention because it may signal improving price strength.
But the first crossover is not always reliable.
A stock can cross above the 50 DMA, remain there for a short period and then fall back below it.
This is sometimes referred to as a false crossover.
One way to get more context is to look at what happens after the crossover.
For example:
-
Does price hold above the 50 DMA?
-
Is the 50 DMA starting to rise?
-
Are higher highs forming?
-
Is volume supporting the move?
-
Is the stock also above the 200 DMA?
-
Is the weekly trend supportive?
The more pieces that agree, the more useful the crossover becomes as part of your analysis.
If you want to explore moving-average crossover setups, you can check the SMA Crossover Scanner on TrendScreener.
For specifically looking at 50 SMA bullish crossovers, the SMA 50 Bullish Crossover scanner can also be useful.
What If the Price Is Far Above the 50 DMA?
This is another situation worth understanding.
A stock being well above its 50 DMA can indicate strong momentum, but it can also mean that the price has moved a long way from its recent average.
That does not automatically mean the stock will fall.
It simply means that chasing the move without looking at the price structure may not be the best approach.
For example, if a stock has suddenly moved 20% above its 50 DMA after a sharp rally, it may be worth checking whether the move is supported by a proper breakout or whether the stock has simply become stretched in a short period.
The distance from the moving average is therefore useful as context, not as a standalone sell signal.
If you are specifically looking for stocks trading close to their moving averages, you can also use the Near SMA Scanner.
Can a Stock Above 50 DMA Still Fall?
Yes.
Absolutely.
The 50 DMA is not a support level that can never break.
A stock can remain above its 50 DMA for weeks or months and then fall below it because of company-specific news, weak results, sector weakness or broader market selling.
This is why a stock being above the 50 DMA should never be interpreted as a guarantee of future performance.
The market can change quickly.
How to Use 50 DMA in a Simple Stock Screening Process
You do not need a complicated system to make the 50 DMA useful.
Step 1: Start With Stocks Above 50 DMA
Create a shortlist of stocks where the current price is above the 50 DMA.
Step 2: Check the Direction of the Moving Average
A rising 50 DMA generally gives a better trend picture than a falling one when you are looking for improving strength.
Step 3: Compare It With the 200 DMA
Check whether the stock is also above its 200 DMA.
This helps you understand whether the recent strength is supported by the longer-term trend.
Step 4: Check the Higher Timeframes
Look at the weekly and monthly trend.
A daily move can sometimes look strong while the larger trend is still weak.
Step 5: Study the Price Structure
Look for higher highs, higher lows, breakouts or a strong move from an important support level.
Step 6: Use Other Indicators Only If They Help
RSI, volume and support/resistance can provide additional information.
There is no need to put every possible indicator on the chart.
A simple setup that you understand well is usually more useful than a chart filled with indicators that you do not regularly use.
How to Find Stocks Above 50 DMA With TrendScreener
If you want to scan Indian stocks using moving-average conditions, you can start with TrendScreener.
The SMA Overview includes scanners for SMA 20, SMA 50, SMA 100 and SMA 200, making it easier to compare stocks around different moving-average levels.
You can also use the Near SMA Scanner when you want to find stocks trading close to an important moving average.
After creating a shortlist, you can look at the broader trend and price action instead of manually checking every stock in the market.
This is where a screener is most useful: it helps you spend less time searching and more time analysing.
Frequently Asked Questions
What does it mean when a stock is above 50 DMA?
It means the current price is trading above the stock's average closing price over the last 50 trading days. Traders often use this as a sign of stronger recent or intermediate-term price action.
Is a stock above 50 DMA bullish?
Not necessarily. A stock above a falling 50 DMA can give a very different signal from a stock above a steadily rising 50 DMA. Price structure and the broader trend should also be considered.
What is the difference between 50 DMA and 200 DMA?
The 50 DMA reacts faster to recent price changes and is commonly used to understand the intermediate trend. The 200 DMA reacts more slowly and is generally used as a longer-term trend reference.
Is it better if a stock is above both 50 DMA and 200 DMA?
It can provide a stronger trend picture because the stock is above both a shorter/intermediate-term and a longer-term moving average. However, it is still not a guaranteed buy signal.
Can a stock below 50 DMA become bullish?
Yes. A stock can move from below its 50 DMA to above it as its price trend improves. The quality of that move depends on factors such as the direction of the 50 DMA, price structure and the broader market trend.
Is 50 DMA useful for short-term trading?
It can be useful as a trend filter, but the 50 DMA itself is a relatively slow indicator compared with very short-term price movements. Short-term traders may combine it with shorter timeframes and price action.
Final Thoughts
Stocks above 50 DMA can be a useful starting point when you are looking for stocks showing recent or intermediate-term strength.
But being above the 50 DMA does not automatically make a stock bullish.
The more useful question is whether the price is above a rising 50 DMA and whether the broader trend supports the move.
Looking at the 50 DMA together with the 200 DMA, weekly and monthly trend, price structure and other relevant indicators can give you a much clearer picture.
A stock screener can make the first filtering step much easier, especially when you are dealing with a large number of Indian stocks.
The goal is not to find a stock that is guaranteed to go up.
The goal is to quickly find stocks that match your criteria and then spend your time doing the analysis that actually matters.