Trading & Stock Market Insights
Learn how to use Trend Screener tools, understand technical indicators and discover practical ways to analyze Indian stocks.
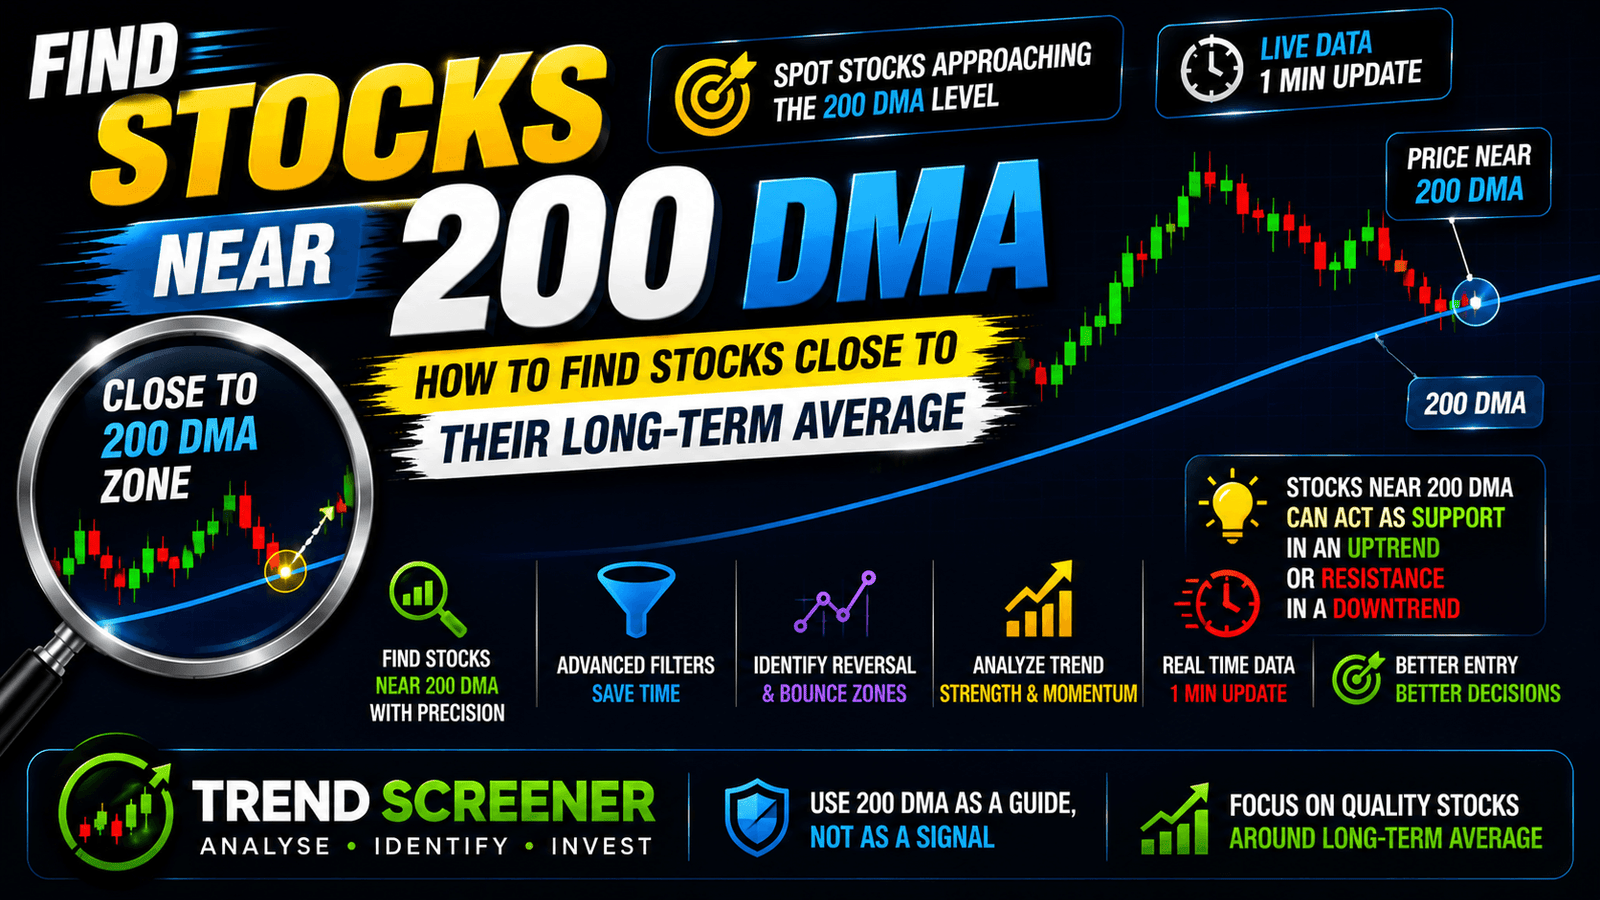
Stocks Near 200 DMA: How to Find Stocks Close to Their Long-Term Average
Find out what stocks near 200 DMA mean, why traders watch this level, and how to analyse stocks trading close to their 200-day moving average.

Stocks Above 50 DMA: How to Find Stocks Showing Short-Term Strength
Learn what stocks above 50 DMA mean, how traders use the 50-day moving average, and how to find Indian stocks showing improving price strength.
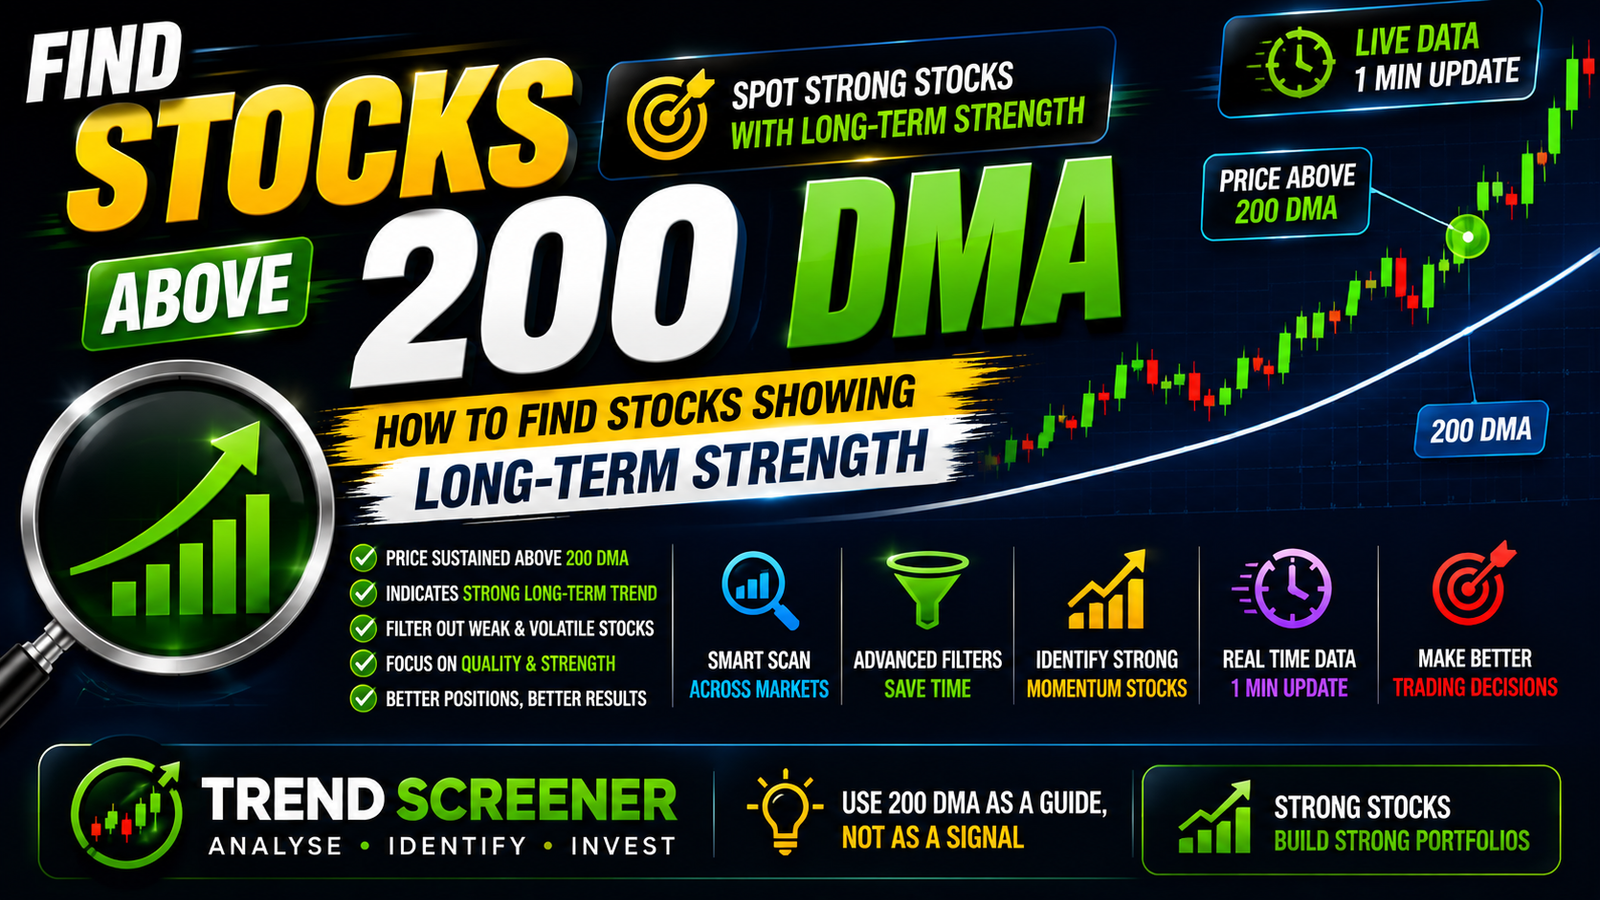
Stocks Above 200 DMA: What It Means & How to Find Them
Learn what stocks above 200 DMA mean, why traders watch this level, and how to find Indian stocks trading above their 200-day moving average.